by Calculated Risk on 12/23/2010 11:13:00 PM
Thursday, December 23, 2010
Repeat: Merle Hazard "Inflation or Deflation"
A little music. This is a repeat from last year, but the debate goes on ...
Earlier:
• Comments on November Personal Income and Outlays Report
• New Home Sales weak in November
Misc: Europe, Consumer Sentiment, and more
by Calculated Risk on 12/23/2010 06:09:00 PM
Note: I'll be posting some tomorrow, and will be on a normal schedule next week.
• A couple of European stories ...
From Reuters: Fitch cuts Portugal rating one notch on debt levels
From Bloomberg: Hungary's Credit Rating Cut by Fitch on Budget; Debt Grade Nears `Abyss'
• From John Carney at CNBC: Bank of America Loses Key Battle In Mortgage Fraud Fight(ht Erik)
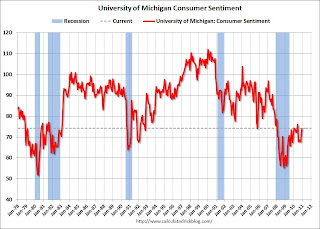
A New York court ruled yesterday that a bond insurer claiming Bank of America’s Countrywide unit fraudulently induced it to insure $21 billion of mortgage-backed securities can use statistical sampling to prove its case.• Earlier, the final Reuters / University of Michigan consumer sentiment index was released. The index increased to 74.5 in December from 71.6 in November (preliminary was 74.2).
 Click on graph for larger image in graphics gallery.
This is the highest level since June 2010, but sentiment is still at levels usually associated with a recession - and sentiment is well below the pre-recession levels.
In general consumer sentiment is a coincident indicator.
Earlier:
• Comments on November Personal Income and Outlays Report
• New Home Sales weak in November
Lawler: Overall Housing Stock Growth Likely to Slow Even Further in 2011
by Calculated Risk on 12/23/2010 02:54:00 PM
From economist Tom Lawler: Overall Housing Stock Growth Likely to Slow Even Further in 2011
Given recent and likely first half housing starts numbers, it seems highly likely that the growth in the US housing stock – which this year was the slowest in US history – will slow even further in 2011, even if housing starts begin to increase next year. Generally there is an average 7-8 month lag between SF housing starts are SF housing completions, and for MF housing starts the average lag is a little over a year. Given what housing starts have done, and given near-term indicators point to low levels of new housing production in the early part of next year, it seems highly likely that overall housing completions will be down in 2011.
While final numbers are not yet in, overall [2010] housing completions plus manufactured housing placements probably will total around 696,000 or so. While there ARE no good timely data on how many homes were on net lost due to demolition, obsolescence, net conversions, etc., past data suggest that somewhere in the range of 300,000 to 325,000 homes were lost this way – implying growth in the housing stock in 2010 (EOY to EOY) of around 371,000 to 396,000. Next year I estimate that housing completions plus MH placements will total around 630,000, implying growth in the housing stock of around 300,000 to 330,000. If the labor market improves and household growth can just move back to 1.1 million a year or so, the combination of faster household growth and de minimus housing-stock growth would put a major dent in the excess supply of housing.CR comments:
For some unknown reason, many housing “analysts” who talk about housing “supply” (shadow inventory, listings, etc.) do not even MENTION the outlook for the supply of the aggregate housing stock!!!!!!!
• Lawler makes an important point: the number of units added to the housing stock next year will be very low, and this means the excess supply will probably be significantly reduced. Of course this also depends on household formation - and that means jobs. (note: I usually estimate demolitions around 200,000 per year - Lawler is using 300,000+ per year.)
• When we discuss residential investment and real GDP growth in 2011, we are talking about growth from the levels at the end of 2010. Even though the overall housing production might be lower in 2011 (per Lawler's forecast), residential investment will probably make a positive contribution to GDP growth for the first time since 2005.
Earlier:
• Comments on November Personal Income and Outlays Report
• New Home Sales weak in November
Comments on November Personal Income and Outlays Report
by Calculated Risk on 12/23/2010 11:58:00 AM
The BEA released the Personal Income and Outlays report for November this morning.
Personal income increased $42.3 billion, or 0.3 percent ... Personal consumption expenditures (PCE) increased $43.3 billion, or 0.4 percent.The following graph shows real Personal Consumption Expenditures (PCE) through November (2005 dollars). Note that the y-axis doesn't start at zero to better show the change.
...
Real PCE -- PCE adjusted to remove price changes -- increased 0.3 percent in November, compared with an increase of 0.5 percent in October.
 Click on graph for large image.
The quarterly change in PCE is based on the change from the average in one quarter, compared to the average of the preceding quarter.
The two-month method of estimating real PCE growth for Q4 (a fairly accurate method), suggests real PCE growth of 4.3% in Q4! So this looks like a pretty strong quarter for growth in personal consumption. The last time real PCE grew at more than 4% was in 2006.
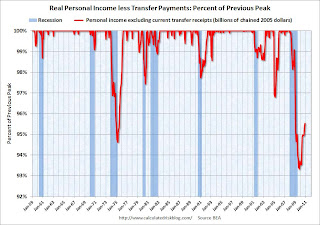
Also personal income less transfer payments increased again in November. This increased to $9,305 billion (SAAR, 2005 dollars) from $9,282 billion in October. This measure had stalled out over the summer.
 This graph shows real personal income less transfer payments as a percent of the previous peak. This has been slow to recover - and is still 4.5% below the previous peak - but personal income less transfer payments is growing again.
Some of the increase in spending came from a decline in the personal saving rate, but overall this was a positive report and suggests solid GDP growth in Q4 (3% or higher).
New Home Sales weak in November
by Calculated Risk on 12/23/2010 10:00:00 AM
The Census Bureau reports New Home Sales in November were at a seasonally adjusted annual rate (SAAR) of 290 thousand. This is up from a revised 275 thousand in October.
 Click on graph for larger image in new window.
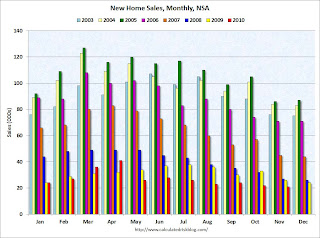
The first graph shows monthly new home sales (NSA - Not Seasonally Adjusted or annualized).
Note the Red columns for 2010. In November 2010, 21 thousand new homes were sold (NSA). This is a new record low for November.
The previous record low for the month of November was 26 thousand in 1966 and 2009; the record high was 86 thousand in November 2005.
 The second graph shows New Home Sales vs. recessions since 1963. The dashed line is the current sales rate.
Sales of new single-family houses in November 2010 were at a seasonally adjusted annual rate of 290,000 ... This is 5.5 percent (±16.2%)* above the revised October rate of 275,000, but is 21.2 percent (±13.3%) below the November 2009 estimate of 368,000And another long term graph - this one for New Home Months of Supply.
 Months of supply decreased to 8.2 in November from 8.8 in October. The all time record was 12.4 months of supply in January 2009. This is still high (less than 6 months supply is normal).
The seasonally adjusted estimate of new houses for sale at the end of November was 197,000. This represents a supply of 8.2 months at the current sales rate.
 The final graph shows new home inventory.
 The 290 thousand annual sales rate for November is just above the all time record low in August (274 thousand). This was the weakest November on record and below the consensus forecast of 300 thousand.
This was another very weak report.
Weekly Initial Unemployment Claims at 420,000
by Calculated Risk on 12/23/2010 08:30:00 AM
The DOL reports on weekly unemployment insurance claims:
In the week ending Dec. 18, the advance figure for seasonally adjusted initial claims was 420,000, a decrease of 3,000 from the previous week's revised figure of 423,000. The 4-week moving average was 426,000, an increase of 2,500 from the previous week's revised average of 423,500.
 Click on graph for larger image in new window.
This graph shows the 4-week moving average of weekly claims since January 2000.
The dashed line on the graph is the current 4-week average. The four-week average of weekly unemployment claims increased this week by 3,000 to 426,000.
In general the four-week moving average has been declining ... and that is good news.


